Thermal Resistance of Floor Coverings
One advantage of using carpet and cushion as floor coverings is that they reduce heat transfer between floors and room air space. This heat flow resistance can result in energy savings. Confusion often exists, however, in understanding how to compare the various types of floor covering material thermal resistance measurements and how to decide which ones are best for particular heating/cooling scenarios in homes and buildings. The purpose of this white paper is to help provide for better floor covering decisions in terms of energy conservation.
Thermal resistance can be measured in a variety of ways, but the most common way is through the use of a heat flow meter. As spelled out in ASTM C518 Standard Test Method for Steady State Thermal Transmission Properties by Means of the Heat Flow Meter Apparatus, the heat flow meter consists of two metal plates in which thermocouples are embedded. One plate is hot and the other is cold. Typically, there will be an approximate 50o F difference in temperature between the two plates. The material being tested is then sandwiched between these two plates and the rate of heat transfer through the material from the hot side to the cold side is measured. The mid point between the hot and cold temperature is referred to as the mean temperature. The diagram below shows this test arrangement.
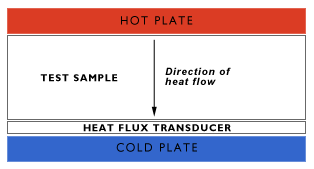
Heat Flow Meter
In engineering terms, the apparatus measures K Factor. Simply put, K Factor is the amount of heat required per hour to raise the temperature of a one square foot, one inch thick sample one degree Fahrenheit. K Factor is independent of thickness, so one can readily compare materials for thermal efficiency by comparing their K values. A lower K implies that a material is a better insulator, while a higher K implies it is better for heat transfer. However, K Factor values are also dependent on the mean temperature used in the test. For instance, a material will be a better insulator (lower K Factor) at a 40o F mean temperature than at a 75o F mean temperature. Care must, therefore, be taken when comparing numbers to assure that the same mean temperature was used in the measurements. Consumers, however, see thermal efficiencies expressed as R values. R value is calculated by dividing the material’s thickness by its K value. For instance, a material one inch thick with a K factor of 0.2 Btu-in/hr-ft2- o F, would have an R value of 5. Because of this thickness dependency, R values can only be compared at the same material thickness. In summary, when comparing materials for thermal efficiency with R values, care must not only be taken to compare them at the same mean temperature, but also at the same thickness. Without this knowledge, such comparisons can be misleading. Finally, when evaluating composites, as with carpet and cushion, R values are additive. A cushion with an R value of 2 and a carpet with an R value of 1 would have an R value of 3 for the composite.
Having explained the science, how can this information help make sound floor covering decisions in terms of energy efficiency? In most cases, floor covering will be used in the insulation mode. In this case, choose cushion and carpet combinations with the highest R values. Remember, certain types of cushion provide superior insulation, but also, thicker cushion will give a higher R value. There is, however, a very important opposite scenario, where heat transfer is the goal. In the case of radiant heated floors, thinner, lower R value combinations are required to maximize heat transfer. In this scenario, too much insulation will require the radiant floor to expend extra energy to facilitate the convection of the heat into the room.
In conclusion, although carpet and cushion are selected primarily for comfort and aesthetics, in these days of high energy costs, they can provide some savings for home owners and businesses on their heating and cooling bills. Below is a table showing relative comparisons of different types of cushion in terms of R value.
Nominal Cushion R Values
Cushion Type |
Avg. R Value/in.* |
1/4” |
3/8” |
7/16” |
1/2” |
Bonded Polyurethane |
3.9 |
1.0 |
1.5 |
1.7 |
2.0 |
Prime/Grafted Prime Polyurethane |
4.0 |
1.0 |
1.5 |
1.8 |
2.0 |
Synthetic Fibers |
3.5 |
0.9 |
1.3 |
1.5 |
1.8 |
Rubber |
|
|
|
|
|
– Rippled Waffle |
2.8 |
0.7 |
1.1 |
1.2 |
1.4 |
– Textured Flat |
1.7 |
0.4 |
0.6 |
0.7 |
0.9 |
Rubber |
|
|
|
|
|
– Reinforced 40 oz |
5.2 |
1.3 |
2.0 |
2.3 |
2.6 |
– Reinforced 50 oz |
3.6 |
0.9 |
1.4 |
1.6 |
1.8 |
– Reinforced 70 oz |
2.9 |
0.7 |
1.1 |
1.3 |
1.5 |
– Reinforced 100 oz |
2.3 |
0.6 |
0.9 |
1.1 |
1.2 |
Mechanically Frothed Polyurethane |
|
|
|
|
|
– 10 pcf |
3.4 |
0.9 |
1.3 |
1.5 |
1.7 |
– 15 pcf |
2.9 |
0.7 |
1.1 |
1.3 |
1.5 |
* hr-ft2-oF/Btu
Note: Check with the manufacturers to determine which cushion thicknesses are actually commercially available.
Example for Using the Above Table for Thicknesses Not Listed
Suppose you have a 15 pcf froth urethane cushion that has a thickness of 1/8”.
R value for this type and thickness would be approximately 1/8 x Avg. R Value/in.
1/8 x 2.9 = 0.4
Finally, contact your cushion manufacturer for a more accurate R Value number for your cushion selection. As stated previously, the cushion is only one component of the R Value of the floor covering composite. You will also have to evaluate your carpet selection to determine the overall R Value of the floor covering composite that you are purchasing.